There is no single swag budget that applies to every employee or company.
Current 2026 figures vary because they measure different programs: annual merchandise allowances, onboarding kits, recognition rewards, event gifts, stipend funding, and other non-cash reward programs. Company size affects total spend and operating complexity, but program design is usually a stronger driver of per-person cost than headcount alone.
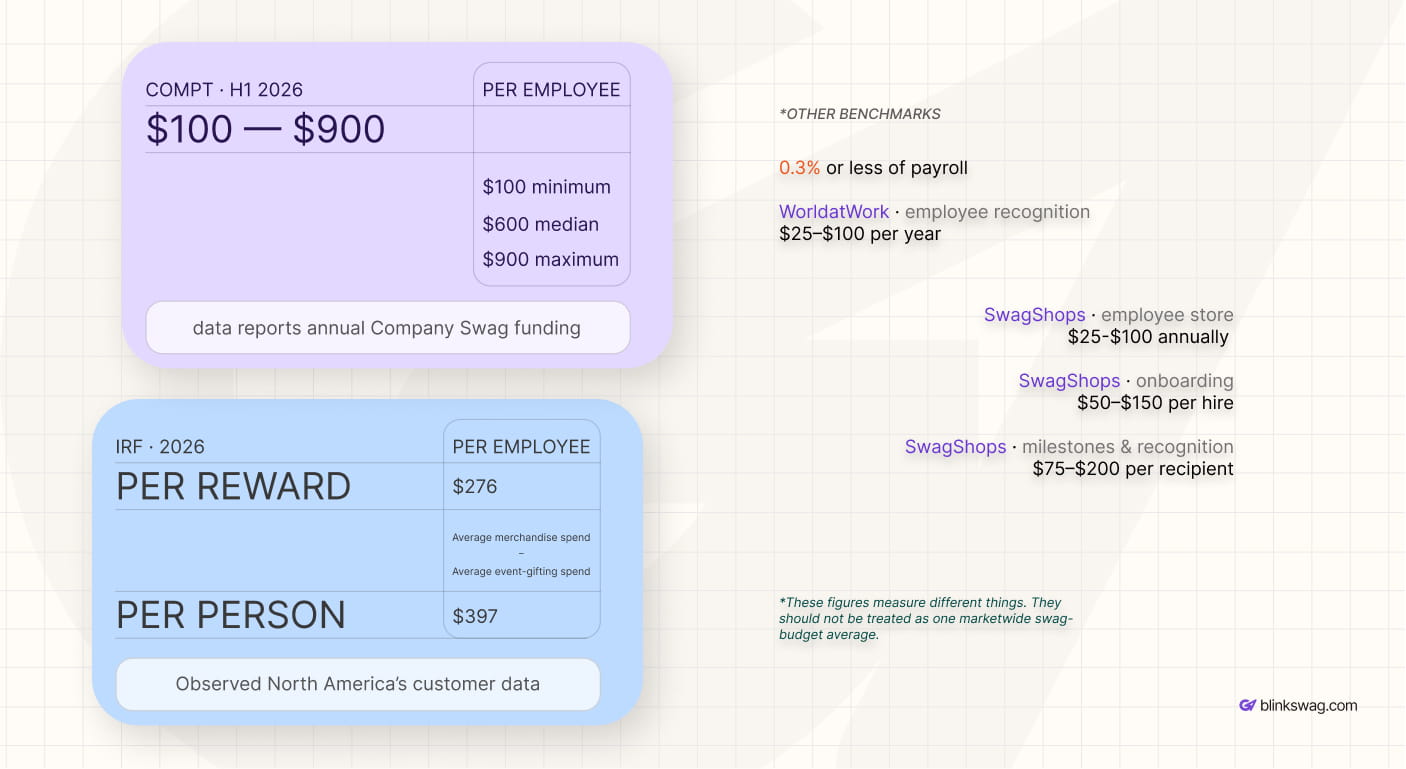
For example, Compt’s H1 2026 customer data reports annual Company Swag stipend-category funding of $100 minimum, $600 median, and $900 maximum per employee. That is observed funding among programs in Compt’s customer dataset. It is not a marketwide estimate of what every employer spends on physical merchandise.
At the same time, current vendor planning guidance can be substantially lower because it may measure individual use cases rather than annual stipend funding. SwagShops, for example, publishes planning ranges of $25-$100 per employee annually for everyday store allowances, $50-$150 per new hire for onboarding kits, and $75-$200 per recipient for milestone or recognition gifts. The company explicitly describes these as planning ranges rather than quotes.
Neither set of figures needs to be wrong. They answer different budgeting questions.
The first step is therefore not choosing a number.
It defines what the number is supposed to measure.
What Does “Swag Budget Per Employee” Actually Mean?

A statement such as:
Our swag budget is $100 per employee.
It is incomplete without a denominator and a cost boundary.
The $100 could mean an annual merchandise allowance for every employee, a one-time onboarding kit for each new hire, a recognition gift for selected recipients, or the blended cost of a larger program that includes shipping and fulfillment.
Those are different financial metrics.
Use the right denominator
| Budget metric | Recommended denominator | What does it tell you |
| Annual employee swag budget | Average active employees | Annual workforce-wide swag cost per employee |
| Onboarding kit budget | New hires receiving kits | Cost per onboarding experience |
| Recognition gift budget | Employees receiving recognition | Cost per recognition occasion |
| Event swag budget | Event attendees or recipients | Cost per event participant |
| Holiday gifting budget | Eligible recipients | Cost per seasonal recipient |
| Total company swag budget | Entire annual program | Total organizational commitment |
| Fulfillment cost | Orders, shipments, or recipients | Cost of delivering the program |
| Blended annual cost per employee | Average active headcount | Total annual program cost spread across the workforce size |
This distinction is fundamental.
Two companies can both say they spend $100 per employee while operating completely different programs.
How Much Should a Company Spend on Swag Per Employee?
There is no established universal amount.
A useful budget should be built from the programs the company actually operates, such as onboarding, recurring employee merchandise, recognition, events, and seasonal gifting, plus the relevant operational costs.
Published figures are most useful when treated as labeled planning inputs rather than spending requirements.
A company should therefore ask:
Which published number measures a program similar to ours?
before asking:
Is this number high or low?
How BlinkSwag Classifies Swag Budget Evidence
Not every dollar figure deserves the same level of confidence.
For this article, budget evidence is separated into the following classes.
| Evidence class | What it means | How to use it |
| Observed dataset | Actual customer or program data from a defined population | Compare only after checking population, category, period, and limitations |
| Survey or research result | Data collected from a defined research sample | Check respondents, geography, question wording, and program context |
| Vendor planning range | Practical guidance published by a supplier or platform | Use for directional planning, not as a universal industry average |
| Illustrative scenario | A calculation based on explicitly stated assumptions | Use to model your own budget, not as evidence of what other companies spend |
| Historical reference | Older research that still provides a useful budgeting context | Use for methodology or historical comparison, not as a current 2026 benchmark |
This classification matters because a number can be accurate within its original study and still be misleading when transferred into a different program.
Do Not Compare These Swag Budget Numbers Directly
Consider the following figures:
| Figure | What it measures | Evidence class |
| $600 | Median annual Company Swag stipend-category funding among Compt customer programs | Observed dataset |
| $276 | Average North American merchandise-reward spend per instance in IRF research | Research result |
| $397 | Average North American event-gifting spend per person in IRF research | Research result |
| $50-$150 | Onboarding-kit planning ranges from SwagShops | Vendor planning range |
| $75-$200 | Recognition/milestone planning ranges from SwagShops | Vendor planning range |
| 0.3% or less of payroll | Historical employee-recognition program budgeting from WorldatWork | Historical survey result |
These figures should not be arranged from “cheap” to “expensive.”
They use different recipients, frequencies, program types, research populations, and denominators.
The correct question is:
What does each figure measure, and which measurement matches the decision we need to make?
2026 Swag Budget Figures: What Current Sources Actually Measure
The following table deliberately avoids combining unlike metrics into a single “average swag budget.”
| Source | Reported figure | What it actually measures | Evidence class | Do not interpret as |
| Compt, H1 2026 | $100 minimum / $600 median / $900 maximum | Annual Company Swag funding per employee within Compt customer programs | Observed customer dataset | Marketwide physical merchandise spend |
| IRF, 2026 | $276 | Average North American merchandise spend per reward instance across non-cash incentive/reward program contexts | Research result | Annual employee swag allowance |
| IRF, 2026 | $397 | Average North American event-gifting spend per person | Research result | Annual employee gifting budget |
| WorldatWork, 2019 | Generally, 0.3% or less of payroll | Employee-recognition program budgeting | Historical survey result | 2026 swag or merchandise spending |
| SwagShops, 2026 | $25-$100 annually | Everyday employee store allowance guidance | Vendor planning range | Independently sampled market average |
| SwagShops, 2026 | $50-$150 per hire | Employee onboarding-kit guidance | Vendor planning range | Annual employee swag budget |
| SwagShops, 2026 | $75-$200 per recipient | Milestone and recognition gift guidance | Vendor planning range | Universal recommended recognition spend |
The evidence becomes much more useful once the measurement boundary is visible.
What Does Compt’s $600 Company Swag Figure Actually Mean?
Compt’s H1 2026 benchmark data reports annual Company Swag funding of:
- $100 minimum
- $600 median
- $900 maximum
per employee within the relevant programs in its customer dataset.
This is valuable because it is an observed dataset rather than a vendor-created hypothetical range.
But its meaning must remain narrow.
The figure can tell us:
Compt customers in this category have funded Company Swag programs at materially different annual levels, with $600 representing the median in that dataset.
It cannot establish:
- the average U.S. employer’s swag spend;
- the amount every employee actually redeems;
- the value of merchandise physically delivered;
- the correct onboarding budget;
- the correct BlinkSwag program budget;
- a universal annual recommendation.
The most accurate description is:
Observed annual Company Swag stipend-category funding among Compt customer programs.
That wording should remain consistent throughout the article.
What Do the IRF 2026 Merchandise Figures Actually Measure?
The Incentive Research Foundation’s Industry Outlook for 2026 provides primary research on non-cash reward programs.
IRF collected 400 responses, split evenly between North America and Europe. The organizations represented multiple program types: 356 offered employee rewards and recognition programs, 313 offered sales incentive programs, and 185 provided channel reward programs.
For North America, the report found:
- average merchandise spend of $276 per instance;
- The average event-gifting spend is $397 per person.
Those are useful current benchmarks.
They are not annual benchmarks for employee swag.
Why the context matters
The $276 figure relates to individual merchandise reward instances across non-cash reward and incentive contexts.
The research includes employee, sales, and channel programs, and IRF notes that channel programs tend to spend more on merchandise than other program types.
Therefore:
$276 per merchandise reward instance
should not become:
$276 per employee per year for swag.
The frequency and program type would need to be known before an annual per-person cost could be calculated.
WorldatWork: A Historical Recognition Budget Reference
WorldatWork’s 2019 Trends in Employee Recognition research provides a different type of evidence for budgeting.
The survey found that recognition programs were generally budgeted at 0.3% or less of payroll. Among the 2019 respondents represented in its payroll-percentage chart, 48% fell in the 0.1%-0.3% of payroll band.
This is useful as a historical example of payroll-based recognition budgeting.
It is not evidence for a current swag-specific dollar amount.
Correct interpretation
Evidence class: Historical survey result
Program: Employee recognition
Metric: Recognition program budget as a percentage of payroll
Study period: 2019
It should not be relabeled as:
- 2026 swag spending;
- physical merchandise cost;
- onboarding-kit budget;
- annual corporate gifting spend;
- a universal per-employee merchandise benchmark.
What Percentage of Payroll Should a Company Spend on Swag?
There is no established payroll percentage for swag specifically in the evidence reviewed for this article.
WorldatWork’s 2019 research found that recognition programs were generally budgeted at 0.3% or less of payroll, but they can include activities and rewards beyond physical swag.
The WorldatWork figure should therefore be used as:
a historical recognition-budget reference
rather than:
a recommended payroll percentage for swag.
Claims that WorldatWork recommends 1%-2% of payroll for swag or employee recognition should not be repeated unless a primary source supporting that recommendation is identified.
Converting a Payroll Percentage Into a Planning Scenario
A payroll percentage can still be converted mathematically into a per-employee scenario.
Suppose a company has an average annual payroll of $70,000 per employee.
At 0.1% of payroll:
$70,000×0.001=$70\$70{,}000 \times 0.001 = \$70
At 0.2%:
$70,000×0.002=$140\$70{,}000 \times 0.002 = \$140
At 0.3%:
$70,000×0.003=$210\$70{,}000 \times 0.003 = \$210
| Assumed payroll per employee | Assumed recognition allocation | Derived amount per employee |
| $70,000 | 0.1% | $70 |
| $70,000 | 0.2% | $140 |
| $70,000 | 0.3% | $210 |
These are illustrative calculations.
WorldatWork did not state that companies should spend $70- $210 per employee on swag.
That result comes from applying a stated salary assumption to a historical payroll-percentage reference.
Why Published Swag Budget Numbers Conflict
Six variables can explain most apparent benchmark conflicts.
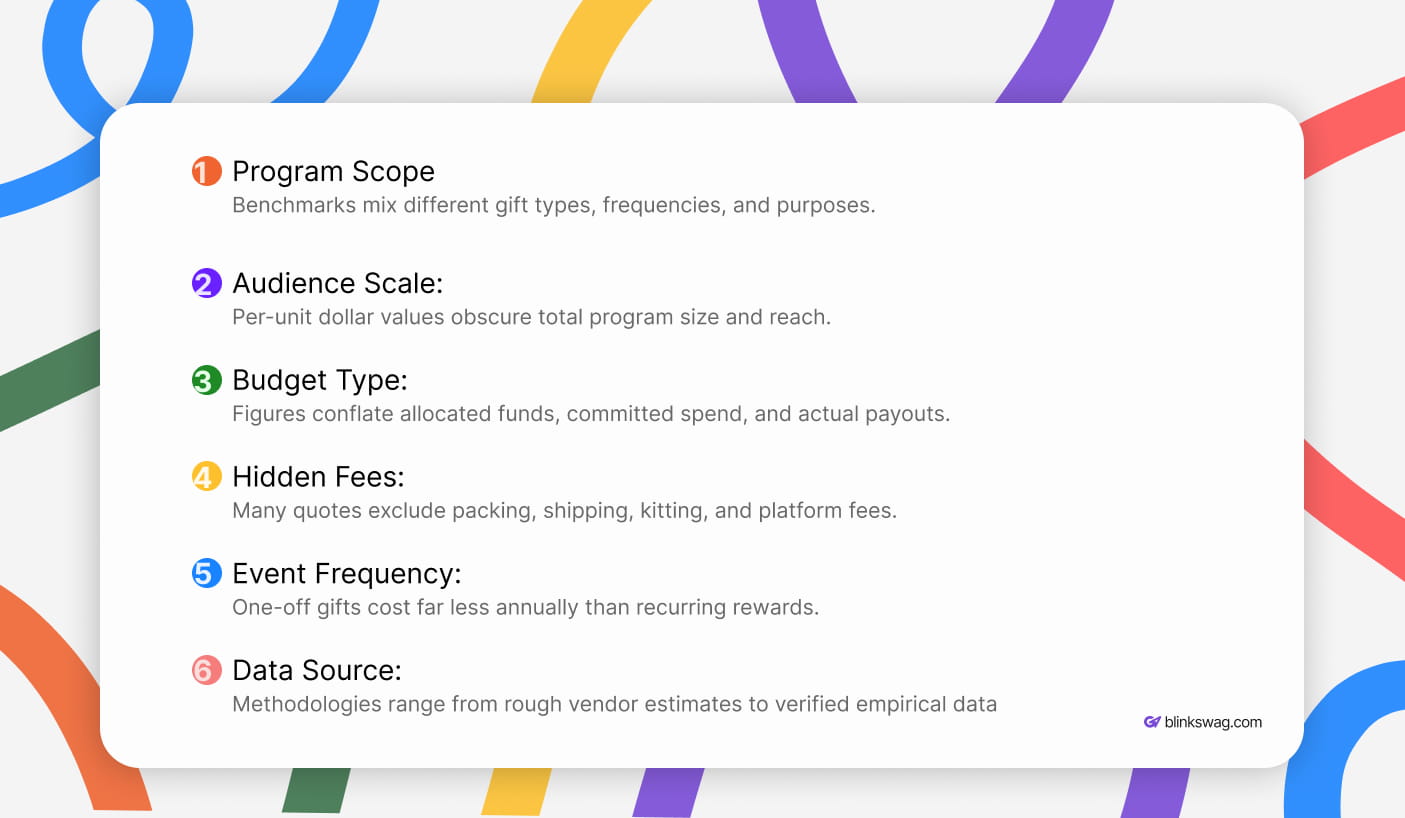
1. Different programs are being measured
An onboarding kit, annual merchandise allowance, recognition reward, event gift, and company store allowance serve different purposes and are awarded at different frequencies.
They should not share one benchmark without qualification.
2. The denominators are different
A $50 event allocation can apply to 2,000 attendees.
A $150 milestone gift might apply to 40 employees.
A $600 annual stipend could be made available to every eligible employee.
The dollar value alone does not tell you the program’s annual economics.
3. Allocation and actual spend are not always the same
A company may allocate $200 to an employee without ultimately spending the full $200.
Another company may purchase $200 of physical inventory upfront before the recipient’s demand is known.
Both might describe the program as having a “$200 budget,” but their financial exposure is different.
The second half of this article separates allocated budget, committed spend, and actual spend.
4. Some figures include only merchandise
A product quote may exclude:
- decoration;
- packaging;
- kitting;
- fulfillment;
- shipping;
- storage;
- duties;
- replacement shipments;
- platform costs;
- administration.
A fair comparison requires a consistent cost boundary.
5. Frequency changes the annual cost
One $100 gift per year does not have the same annual economics as four $100 recognition moments.
A per-instance benchmark cannot automatically be converted to an annual benchmark without knowing the frequency.
6. Source methodology changes what the number represents
Observed customer data, an independent research study, vendor guidance, and a BlinkSwag planning scenario should not be given identical evidentiary weight.
This is why the evidence class should travel with the number.
Swag Budget by Company Size: Operating Models, Not Fixed Rates
Company size matters.
But its main effect is on:
scale + operational complexity + governance
rather than automatically determining how generous the per-person budget should be.
Small Companies: 1- 50 Employees
Smaller organizations often have:
- fewer recipient cohorts;
- lower total merchandise volume;
- fewer concurrent campaigns;
- more flexibility to personalize gifts;
- less need for complex inventory infrastructure;
- potentially higher unit costs at low quantities.
A small company can also choose to spend more per employee because the total recipient population is limited.
What Is a Good Swag Budget for a 50-Person Company?
There is no fixed 50-person-company rate.
A company with 50 employees that provides eight onboarding kits and one annual appreciation gift has a different cost structure from that of another 50-person company that runs quarterly merchandise, milestone rewards, retreats, recruiting events, and an employee store.
The correct budget comes from the programs being funded, not from headcount alone.
Midsize Companies: 51-500 Employees
As headcount grows, swag programs often become more structured.
Separate budget lines may emerge for:
- onboarding;
- employee appreciation;
- recognition;
- work anniversaries;
- events;
- recruiting;
- departmental merchandise;
- customer gifting.
Operational costs can also increase because more apparel sizes, individual shipments, inventory, recipient groups, and fulfillment events need to be managed.
The budgeting question begins to shift from:
How much does the product cost?
to:
What does the complete program cost per recipient?
Large Companies: 501+ Employees
In larger organizations, program control often becomes as important as the value of individual gifts.
The organization may need to manage:
- departments;
- cost centers;
- recipient eligibility;
- locations;
- countries;
- approvals;
- inventory;
- fulfillment;
- reporting;
- compliance;
- multiple program owners.
At scale, small cost changes also become financially meaningful.
For 5,000 employees:
5,000×$10=$50,0005{,}000 \times \$10 = \$50{,}000
A $10 difference in average annual delivered cost changes the program total by $50,000.
That can make waste reduction, inventory utilization, fulfillment design, and recipient targeting as important as negotiating another dollar off the merchandise price.
Does Swag Budget Per Employee Increase With Company Size?
Not necessarily.
Larger companies normally have higher total spend because more recipients are involved, but current evidence does not support a simple rule that per-employee swag spending rises with headcount.
Compt’s broader H1 2026 stipend and LSA dataset illustrate why caution is appropriate. Across all measured benefit categories, organizations with fewer than 100 employees reported higher average annual per-employee funding than organizations with larger workforces. Those company-size figures are not swag-specific, so they should not be used as benchmarks for swag. Their value here is simply to demonstrate that headcount and per-person funding do not move together in a predictable upward line.
The more useful rule is:
Headcount determines scale. Program design determines a more meaningful per-person budget.
Swag Budget by Program Type
The most reliable way to construct a budget is to separate the programs before calculating the annual total.
Recurring Employee Swag
Recurring employee swag can include:
- company-store allowances;
- annual apparel;
- periodic merchandise;
- team swag;
- recurring merchandise credit.
SwagShops currently provides a $25- $100 per-employee annual vendor-planning range for everyday store allowances. It explicitly characterizes its figures as planning ranges rather than quotes.
Compt’s observed Company Swag stipend-category funding is considerably higher, with a $600 median in its H1 2026 customer data.
The difference should not be “resolved” by averaging the two.
The programs and evidence classes differ.
Employee Onboarding
Onboarding should normally use new hires receiving the kit as its denominator, rather than the total company headcount.
SwagShops currently provides a $50-$150 per-new-hire planning range for onboarding kits.
A secondary current vendor example, Arklavo, publishes a narrower $40- $85 per-new-hire onboarding kit range. Because both are vendor-authored planning estimates rather than independent market studies, they should be treated as directional inputs rather than averaged into an “industry benchmark.”
The final cost also depends on whether the quoted range includes:
- decoration;
- packaging;
- kitting;
- fulfillment;
- shipping.
Recognition and Milestones
Recognition programs should generally use the number of eligible or recognized recipients, unless every employee is guaranteed the same reward.
SwagShops provides $75-$200 per recipient as current vendor planning guidance for milestone and recognition gifts.
IRF provides a different type of reference: an average merchandise spend of $276 per instance in North America for non-cash rewards and incentive programs, as reported in its 2026 study.
Those two figures should remain separate because one is vendor guidance and the other is research covering several types of reward programs.
Event Swag and Event Gifting
Event budgeting should generally use the attendee or recipient count.
A mass conference giveaway and premium event gifting serve different purposes, so both “event spend” figures can be valid without being comparable.
SwagShops provides a $ 3-$25-per-attendee planning range for events and recruiting.
IRF reports average North American event-gifting spend of $397 per person in its 2026 research. The same study discusses a broad rewards and event-gifting environment, not low-cost conference giveaways specifically.
The difference is a useful illustration of why the word event is not enough context for a benchmark.
Should Swag Come From the HR, Marketing, or Procurement Budget?
There is no single correct budget owner.
Ownership should follow the program’s purpose.
HR or People Operations may own employee onboarding, appreciation, recognition, or internal merchandise.
Marketing or Events may own conference swag, campaigns, brand merchandise, or event distribution.
Sales or Customer Success may own prospect or client gifting.
Procurement may manage vendors, purchasing standards, inventory, and commercial controls even when another department owns the budget.
Finance may define approval limits and reporting requirements across all of them.
At more mature organizations, the program can therefore be centrally governed but funded by several cost centers.
That is different from forcing every type of swag into one company-wide budget.
What Should Be Included in a Swag Budget?
A swag budget should cover more than the merchandise itself.
The most useful planning number is the delivered program cost, meaning the amount required to move from product selection to a completed recipient experience.
Depending on the program, that can include:
- merchandise or reward value;
- decoration or customization;
- packaging;
- kitting;
- fulfillment;
- shipping;
- storage;
- platform costs;
- applicable duties and taxes;
- replacement shipments;
- program administration;
- contingency.
A $40 product is therefore not automatically a $40-per-employee program.
If that product also requires decoration, packaging, kitting, individual fulfillment, and shipping, the final cost can be materially higher.
Does Shipping Count Toward a Swag Budget?
Yes, when the goal is to calculate the program’s true delivered cost.
Finance may choose to report merchandise and logistics under separate accounting categories, but program planning should still account for both.
Otherwise, two suppliers quoting the same product price can appear equally expensive, even when their delivered economics differ significantly.
How to Calculate Delivered Swag Cost
A practical recipient-level formula is
Delivered Swag Cost=Product or Reward+Decoration+Packaging+Kitting+Fulfillment+ Shipping+Applicable Duties/Taxes+Replacement/Contingency\text{Delivered Swag Cost} = \text{Product or Reward} + \text{Decoration} + \text{Packaging} + \text{Kitting} + \text{Fulfillment} + \text{Shipping} + \text{Applicable Duties/Taxes} + \text{Replacement/Contingency}
For an ongoing program, add shared costs separately:
Total Program Cost=Recipient-Level Delivered Costs+Storage+Platform+Program Administration\text{Total Program Cost} = \text{Recipient-Level Delivered Costs} + \text{Storage} + \text{Platform} + \text{Program Administration}
Not every program includes every component.
A conference giveaway distributed from one booth can have a very different cost structure from a global employee onboarding program with personalized kits shipped to residential addresses.
The important rule is:
Use the same cost boundary when comparing alternatives.
That leads to a more useful buying principle:
The lowest unit price does not always equal the lowest delivered cost per used item.
Product Price vs. Delivered Program Cost
Consider two simplified options.
| Cost component | Option A | Option B |
| Product | $32 | $38 |
| Decoration | $4 | $4 |
| Packaging | $6 | $4 |
| Kitting/fulfillment | $7 | $5 |
| Shipping | $12 | $9 |
| Delivered cost | $61 | $60 |
Option A has the cheaper product.
Option B has the lower delivered cost.
This is why purchasing decisions should not be made from product price alone.
The same principle becomes more important when inventory, storage, failed deliveries, replacements, or unused merchandise are involved.
Allocated Budget vs. Committed Spend vs. Actual Spend
The word budget can describe several different financial states.
They should be separated.
| Metric | Meaning | Example |
| Allocated budget | Amount made available to a recipient, team, or program | $200 annual merchandise allowance |
| Committed spend | Amount already ordered, reserved, or contractually obligated | 500 jackets purchased in advance |
| Actual spend | Amount ultimately purchased, redeemed, fulfilled, shipped, and incurred | Actual program cost after use |
| Delivered value | Merchandise or reward value successfully delivered to recipients | Value recipients actually received |
The fourth metric, delivered value, is useful because money can be spent without creating value for the recipient.
For example, merchandise sitting unused in storage is an actual company cost, but it has not yet become delivered recipient value.
Why Allocation and Actual Spend Can Be Different
Suppose 500 employees each receive a $200 annual merchandise allocation.
Maximum allocated value:
500×$200=$100,000500 \times \$200 = \$100{,}000
That does not automatically mean the organization will spend $100,000.
If products are purchased only after employees redeem their allowance, actual spend may be lower.
If the company purchases $100,000 of inventory in advance, the financial commitment can be made before employees make any selections.
This creates four different questions:
How much value did we make available?
How much did we commit?
How much did we actually spend?
How much value was successfully reached, recipients?
Those questions should not share one number.
BlinkSwag’s Budget Management and Reward Links are relevant to this distinction because program design can control available budgets while separating recipient choice from upfront bulk purchasing.
How to Calculate an Annual Swag Budget
The annual budget should be built program by program.
A useful model is:
Annual Swag Budget=(Active Employees×Recurring Allocation)+(New Hires×Onboarding Cost)+(Milestone Recipients×Milestone Cost)+(Event Recipients×Event Cost)+Shared Program Costs\text{Annual Swag Budget} = (\text{Active Employees} \times \text{Recurring Allocation}) + (\text{New Hires} \times \text{Onboarding Cost}) + (\text{Milestone Recipients} \times \text{Milestone Cost}) + (\text{Event Recipients} \times \text{Event Cost}) + \text{Shared Program Costs}
Shared costs can include:
- storage;
- platform fees;
- program administration;
- design;
- general fulfillment infrastructure;
- inventory management.
Once the total is known, Finance can calculate a blended planning metric:
Blended Annual Cost Per Employee=Total Annual Swag Program CostAverage Active Headcount\text{Blended Annual Cost Per Employee} = \frac{\text{Total Annual Swag Program Cost}} {\text{Average Active Headcount}}
Important distinction
A blended annual cost of $150 per employee does not mean every employee personally received $150 of merchandise.
Part of that amount can come from onboarding new hires, selective recognition, events, fulfillment, or shared operating costs.
It is a finance metric, not necessarily a recipient entitlement.
Illustrative Swag Budgets by Company Size
The scenarios below are illustrative planning models, not market benchmarks.
They demonstrate how the same budgeting framework changes as headcount, hiring, recognition, events, and operating costs change.
25-Person Startup
Assumptions
- 25 active employees;
- $75 recurring employee allocation;
- 8 new hires at $90 each;
- 5 milestone recipients at $100 each;
- one $25-per-employee event;
- $800 of shared operating costs.
Program allocation
Recurring employee swag:
25×$75=$1,87525 \times \$75 = \$1{,}875
Onboarding:
8×$90=$7208 \times \$90 = \$720
Milestones:
5×$100=$5005 \times \$100 = \$500
Event:
25×$25=$62525 \times \$25 = \$625
Program allocations total:
$3,720\$3{,}720
Shared operating costs:
$800\$800
Illustrative annual budget
$3,720+$800=$4,520\$3{,}720 + \$800 = \boxed{\$4{,}520}
Blended annual cost per active employee
$4,520÷25=$180.80\$4{,}520 \div 25 = \boxed{\$180.80}
150-Person Growing Company
Assumptions
- 150 active employees;
- $75 recurring allocation;
- 35 new hires at $100;
- 30 milestone recipients at $125;
- one $30-per-employee event;
- $4,000 shared operating costs.
Program allocation
| Program | Illustrative cost |
| Recurring swag | $11,250 |
| Onboarding | $3,500 |
| Milestones | $3,750 |
| Event | $4,500 |
| Program allocation subtotal | $23,000 |
| Shared operating costs | $4,000 |
| Annual total | $27,000 |
Blended annual cost:
$27,000÷150=$180\$27{,}000 \div 150 = \boxed{\$180}
The company is six times larger than in the first scenario, but the blended result is almost identical.
That is intentional.
It demonstrates why company size alone does not determine per-person cost.
500-Person Midsize Company
Assumptions
- 500 active employees;
- $60 recurring allocation;
- 100 new hires at $110;
- 100 milestone recipients at $125;
- one $25-per-employee event;
- $12,000 shared operating costs.
| Program | Illustrative cost |
| Recurring swag | $30,000 |
| Onboarding | $11,000 |
| Milestones | $12,500 |
| Event | $12,500 |
| Program allocation subtotal | $66,000 |
| Shared operating costs | $12,000 |
| Annual total | $78,000 |
Blended annual cost:
$78,000÷500=$156\$78{,}000 \div 500 = \boxed{\$156}
2,500-Person Enterprise
Assumptions
- 2,500 active employees;
- $50 recurring allocation;
- 350 new hires at $100;
- 500 milestone recipients at $125;
- 1,500 event recipients at $25;
- $60,000 shared operating costs.
| Program | Illustrative cost |
| Recurring swag | $125,000 |
| Onboarding | $35,000 |
| Milestones | $62,500 |
| Event | $37,500 |
| Program allocation subtotal | $260,000 |
| Shared operating costs | $60,000 |
| Annual total | $320,000 |
Blended annual cost:
$320,000÷2,500=$128\$320{,}000 \div 2{,}500 = \boxed{\$128}
What the Company-Size Scenarios Show
| Company scenario | Headcount | Program allocation | Shared operating cost | Annual total | Blended cost |
| Startup | 25 | $3,720 | $800 | $4,520 | $180.80 |
| Growing company | 150 | $23,000 | $4,000 | $27,000 | $180 |
| Midsize company | 500 | $66,000 | $12,000 | $78,000 | $156 |
| Enterprise | 2,500 | $260,000 | $60,000 | $320,000 | $128 |
These numbers should not be interpreted as recommended spending by company size.
They demonstrate a planning method.
A real organization can arrive at a much higher or lower result depending on its products, program cadence, recipient groups, operating model, and delivery costs.
Bulk vs. On-Demand Swag: Which Costs Less?
The answer depends on what cost means.
Bulk production can improve unit economics.
On-demand or recipient-choice models can reduce exposure to unused inventory.
| Cost factor | Bulk | On-demand / recipient-choice |
| Unit cost | Often improves with volume | Can be higher |
| Upfront commitment | Typically greater | Can be lower |
| Inventory exposure | Higher | Lower |
| Storage needs | Often greater | Can be reduced |
| Size forecasting | Required for apparel inventory | Can be reduced where recipients select first |
| Obsolescence risk | Higher | Often lower |
| Recipient choice | Limited by purchased inventory | Can be greater |
| Immediate stock availability | Can be strong | Depends on the production model |
| Forecasting dependency | Higher | Lower in some workflows |
Is Bulk Swag Cheaper Than On-Demand Swag?
Bulk can be cheaper per unit, but it is not automatically cheaper on a total-cost basis.
The comparison should include:
Total Economic Cost=Purchase Cost+Storage+Handling+Waste+Redistribution+Obsolescence\text{Total Economic Cost} = \text{Purchase Cost} + \text{Storage} + \text{Handling} + \text{Waste} + \text{Redistribution} + \text{Obsolescence}
The more useful decision metric is:
delivered cost per product actually used
rather than:
purchase price per unit ordered
The Hidden Cost of Unused Swag
Suppose a company orders 1,000 items because the unit price falls at that volume.
Only 700 are eventually distributed.
The purchasing report may still show an attractive unit price.
But the organization paid for 300 items that have not created value for recipients.
Unused inventory can result from:
- over-ordering;
- inaccurate headcount assumptions;
- apparel-size imbalance;
- low product relevance;
- employee turnover;
- canceled events;
- outdated branding;
- duplicate merchandise;
- poor demand forecasting.
Recipient choice can reduce some of these forecasting risks when products are purchased or fulfilled based on actual recipient selections.
It does not automatically eliminate waste under every operating model.
How Remote and Global Teams Change Swag Budgets
A distributed program can have a different cost structure from an office-based program even when headcount is identical.
A company with 200 employees in a single office might ship merchandise to a single central location.
A remote company with 200 employees may require 200 individual deliveries.
International programs can add further variables:
- international freight;
- customs procedures;
- duties;
- local taxes;
- regional product availability;
- residential shipping;
- failed delivery handling;
- address collection;
- replacement shipments;
- regional fulfillment partners.
Does Remote Work Increase Swag Costs?
It can increase external fulfillment and shipping costs because products may need to be delivered individually rather than as a single bulk shipment.
But the comparison should also consider costs the remote model may reduce, such as internal receiving, office storage, and employee time spent manually distributing merchandise.
The relevant measure is the complete delivery model, not shipping cost in isolation.
How to Reduce Swag Spend Without Buying Worse Swag
Budget optimization does not have to mean buying cheaper products.
A stronger strategy is to eliminate spending that provides little or no value to recipients.
Reduce low-utility merchandise
Several inexpensive products that recipients do not use can create less value than a single useful item within the same total budget.
Reduce excess inventory
Better forecasting, smaller inventory commitments, or on-demand models can reduce exposure to unwanted products.
Use recipient choice selectively
Choice can be particularly useful when the recipient’s needs vary by:
- apparel size;
- dietary preference;
- device compatibility;
- geography;
- product ownership;
- lifestyle.
Consolidate shipments where appropriate.
Combining products or coordinating campaigns can reduce repeated fulfillment and shipping.
Plan earlier
Rush production and expedited shipping can increase cost while reducing product availability.
Monitor aging inventory
Products that remain unused should remain visible in budget reporting.
They should not disappear simply because they were purchased in a previous period.
Track redemption and utilization
A recipient-choice program should measure whether available value is actually being used.
Low utilization can indicate:
- weak product relevance;
- poor communication;
- redemption friction;
- poor timing;
- confusing selection;
- insufficient perceived value.
The correct response is not automatically to increase the budget.
First, determine why recipients are not using it.
How to Set a Swag Budget Employees Can Actually Use
Financial efficiency alone does not make a successful employee swag program.
The budget needs to work for the recipient.
Consider:
- usefulness;
- quality;
- choice;
- branding intensity;
- accessibility;
- sizing;
- location;
- eligibility;
- redemption friction;
- delivery experience.
A $75 curated allowance can deliver more value to recipients than a $150 allocation filled with irrelevant options.
Similarly, hundreds of products do not automatically make for a better choice.
A smaller assortment can work better when every available option has been deliberately selected for the recipient group and budget.
BlinkSwag’s Reward Links provide one model for combining recipient choice with defined reward budgets.
Allocation Is Not Utilization
If an employee receives a $200 allocation but redeems $120, two valid figures exist:
Allocated value: $200
Redeemed value: $120
A third figure may also exist:
Delivered cost: the actual merchandise, fulfillment, shipping, and related costs incurred.
Whether the unused $80 becomes a company savings depends on the program design.
If the inventory was already purchased, the cost may already exist.
If products are purchased only after redemption, the unused allocation may never become actual spend.
Budget reporting should therefore distinguish:
allocated → committed → redeemed → delivered
This produces much more useful financial insight than reporting a single “budget per employee” number.
Build Your Swag Budget
Until an interactive calculator is implemented on the page, the framework below can be used as a manual budgeting worksheet.
Step 1: Workforce inputs
Average active employees: ______
Expected annual new hires: ______
Step 2: Recurring employee program
Active Employees×Annual Allocation\text{Active Employees} \times \text{Annual Allocation}
Step 3: Onboarding
New Hires×Onboarding Cost\text{New Hires} \times \text{Onboarding Cost}
Step 4: Recognition and milestones
Eligible Recipients×Average Recognition Cost\text{Eligible Recipients} \times \text{Average Recognition Cost}
Step 5: Events
Event Recipients×Event Allocation\text{Event Recipients} \times \text{Event Allocation}
Step 6: Operational costs
Add:
- packaging;
- kitting;
- fulfillment;
- shipping;
- storage;
- platform;
- administration;
- duties and taxes;
- contingency.
Step 7: Calculate annual total
Annual Budget=Recurring+Onboarding+Recognition+Events+Operations\text{Annual Budget} = \text{Recurring} + \text{Onboarding} + \text{Recognition} + \text{Events} + \text{Operations}
Step 8: Calculate blended employee cost
Blended Cost Per Employee=Annual Program CostAverage Active Headcount\text{Blended Cost Per Employee} = \frac{\text{Annual Program Cost}} {\text{Average Active Headcount}}
How Finance Should Evaluate Swag Spend
Finance should avoid relying on one blended number.
A stronger dashboard separates at least:
Allocation
How much value was made available?
Commitment
How much money was contractually or financially obligated?
Actual spend
How much cost was incurred?
Redemption
How much available value was claimed?
Delivered value
How much merchandise or reward value was successfully reached by the recipients?
Operational cost
How much was spent on fulfillment, shipping, storage, administration, and related infrastructure?
This makes it possible to identify whether a program is expensive because of:
- merchandise value;
- logistics;
- poor utilization;
- inventory waste;
- excessive shipping;
- program complexity.
Is $100 Per Employee Enough for Swag?

It can be, depending on what the $100 must cover.
A $100 budget may support:
- one quality annual product;
- a modest onboarding kit;
- one recognition occasion;
- a curated merchandise selection.
It may be insufficient if the same amount is expected to cover:
- recurring merchandise;
- onboarding;
- multiple recognition moments;
- events;
- international shipping;
- fulfillment;
- platform costs.
The better question is:
What must the $100 accomplish?
Once the program is defined, the answer becomes much more useful.
What Should Companies Measure After the Budget Is Approved?
Budgeting should not stop when money is allocated.
Useful post-program metrics can include:
- redemption rate;
- delivered cost per recipient;
- fulfillment cost per order;
- shipping cost per recipient;
- unused inventory;
- stock aging;
- replacement rate;
- program utilization;
- cost by program type;
- actual spend versus allocated budget.
These metrics answer different questions.
For example, a high redemption rate shows that recipients claimed the offer.
It does not automatically prove that recipients valued the merchandise or that the program improved retention, engagement, or another business outcome.
Measurement should remain tied to the question being asked.
Methodology and Limitations
BlinkSwag separates different kinds of budget evidence rather than presenting them as interchangeable market averages.
The article distinguishes:
observed datasets
research and survey findings
Vendor planning ranges
historical references
illustrative calculations
Every financial figure should be interpreted according to:
- source population;
- period;
- geography where relevant;
- program type;
- denominator;
- included costs;
- evidence class.
Vendor guidance can help teams establish planning ranges, but a vendor estimate does not become a universal market benchmark simply because another supplier publishes a similar number.
Similarly, a figure from an incentive study should not be relabeled as employee swag spending unless the study actually measured employee swag.
The Bottom Line
The best swag budget is not the number that appears most frequently in search results.
It is the number whose:
recipient + program + frequency + denominator + cost boundary
match the decision your company actually needs to make.
Company size determines scale and usually increases operational complexity.
It does not automatically determine per-employee generosity.
A strong budgeting process, therefore, moves in this order:
Define the recipient → define the program → define the frequency → define the full cost → select comparable evidence → model the budget → measure actual utilization.
That is the difference between copying a swag benchmark and building a swag budget that can actually be defended.