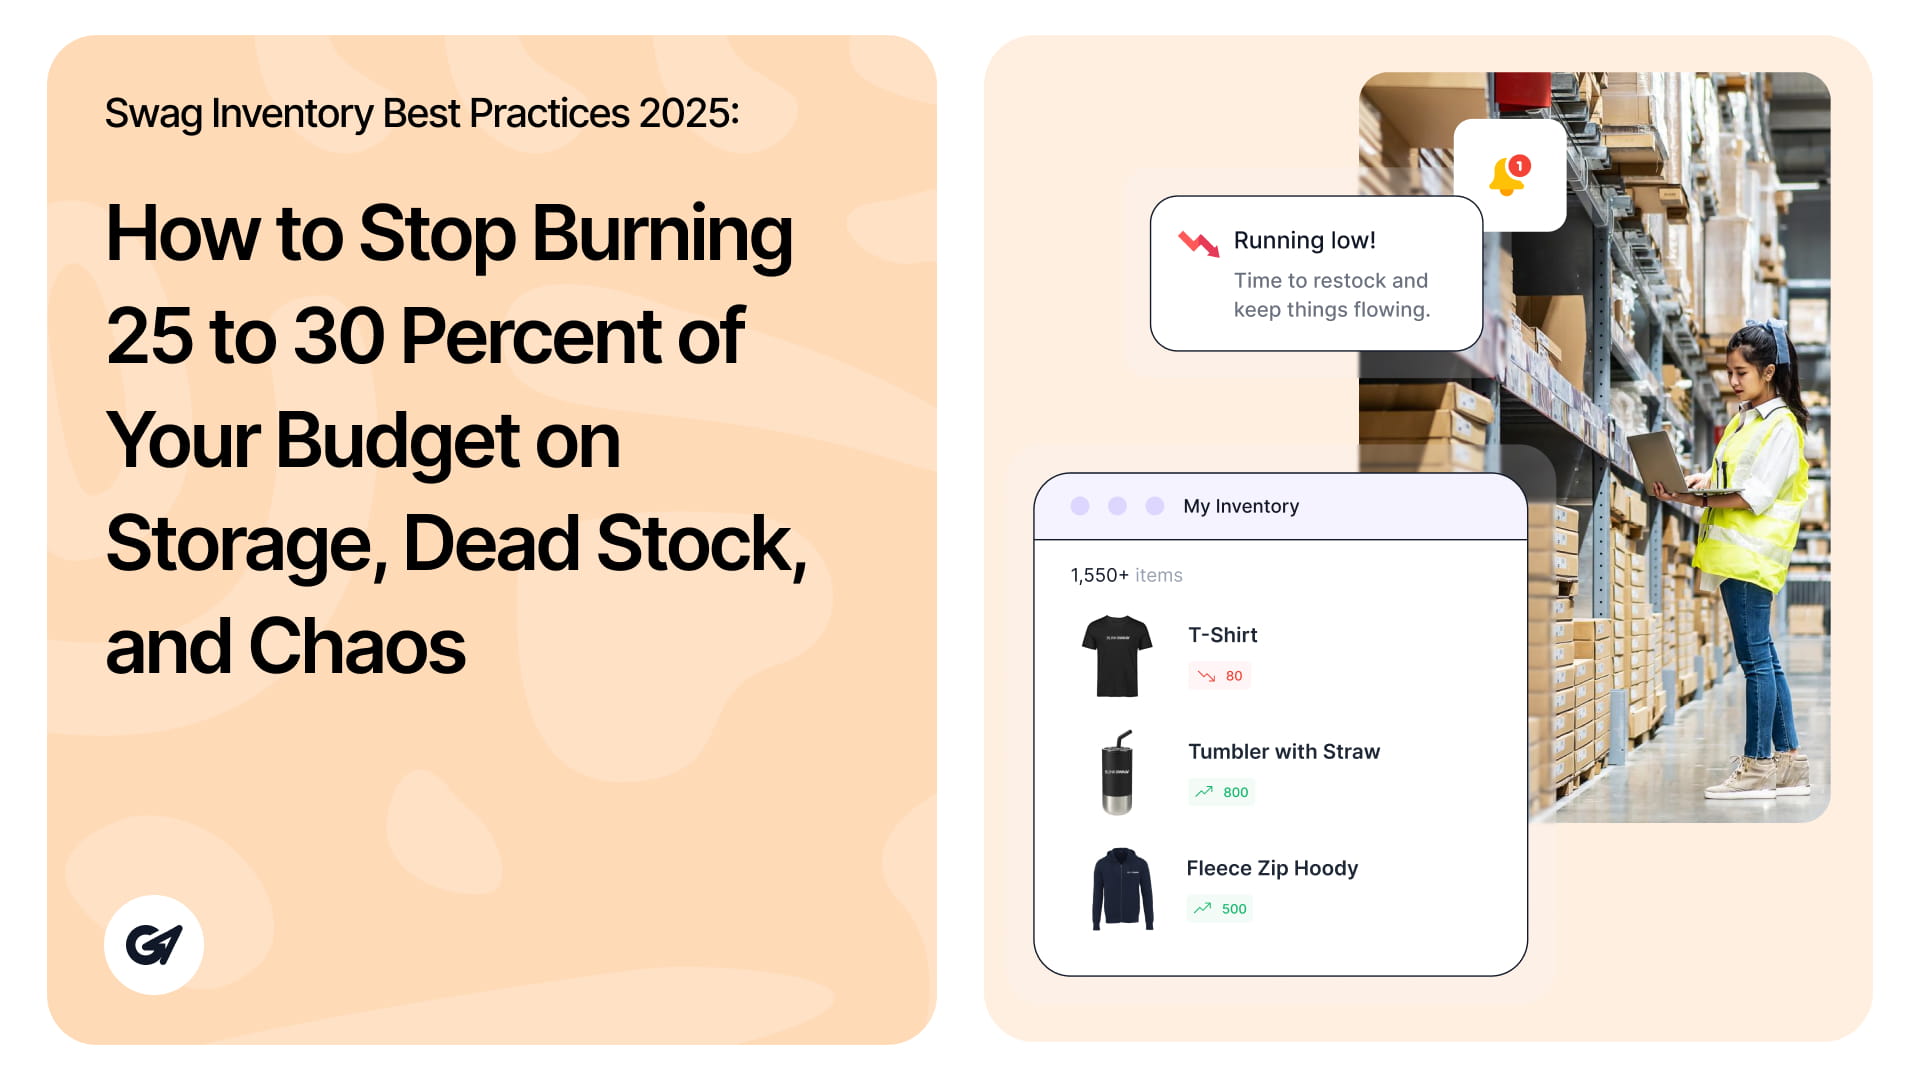
How to Stop Burning 25 to 30 Percent of Your Budget on Storage, Dead Stock, and Chaos
Most companies do not have a swag problem. They have a visibility problem. Boxes hide in closets. SKUs become duplicated. Old logo products sit untouched for a year or more.
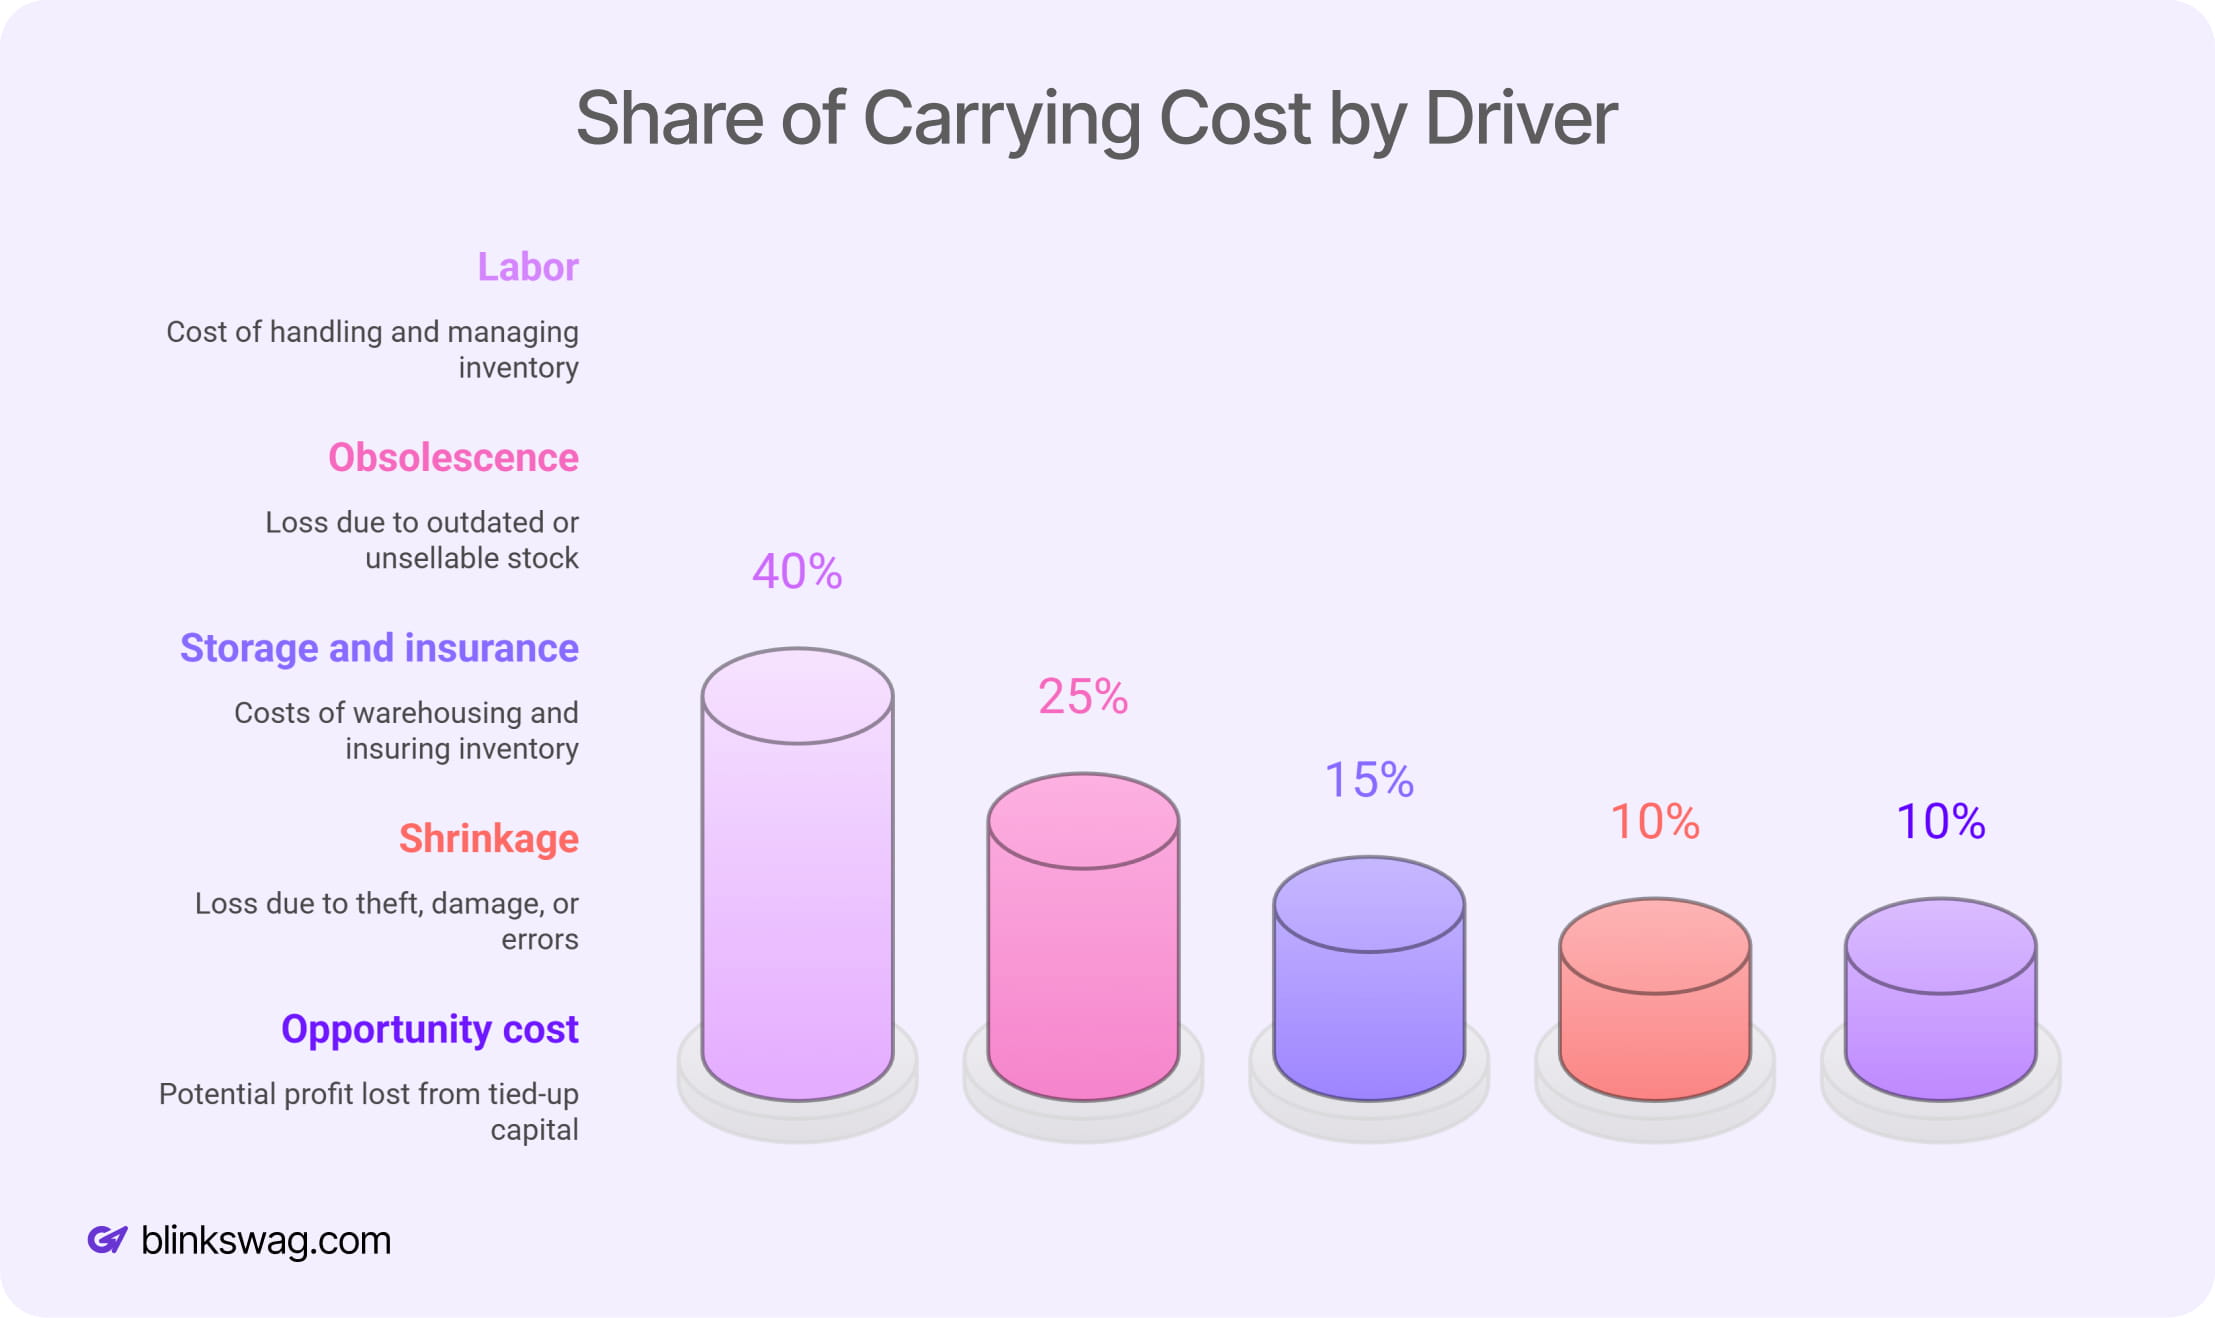
From a finance perspective, this is not clutter. It is a slow, silent budget drain. A fifty-thousand-dollar swag order can turn into more than two hundred thousand dollars in total cost across three years once you add storage, labor, obsolescence, and the money you could have invested elsewhere.
This concise guide provides a clear line of sight. You will see how to score your current program, understand actual carrying cost, decide between bulk, on-demand, and hybrid, and track a few KPIs that keep your swag program out of closet chaos. Every step is designed so that BlinkSwag can either do the heavy lifting for you or integrate with what you already have.
The Real Cost Of Swag Inventory
Most teams budget for the product itself. The real cost lies in everything that happens after the cartons arrive. Here is what a $50,000 swag order can actually cost if it sits in storage.
Example cost breakdown for 50,000 dollars in swag:
| Cost component | Typical range | Example for 50,000 dollars in swag |
| Storage and insurance | 5 to 15 dollars per sq. ft. per year, plus 1 to 2% | About 4,000 dollars per year |
| Labor for receiving, picking, and packing | 10 to 15 percent of the inventory value | 5,000 to 7,500 dollars per year |
| Obsolescence and dead stock | 5 to 10 percent annually | 2,500 to 5,000 dollars per year |
| Shrinkage from loss or damage | 2 to 3 percent | 1,000 to 1,500 dollars per year |
| Opportunity cost of capital | A 6 to 8 percent annual return, you do not earn | 3,000 to 4,000 dollars per year |
Add those layers, and the carrying cost alone can reach 25 to 30 percent of inventory value every year. Over three years, the original $50,000 order can exceed $200,000 in total spend if it moves slowly.
A 356-person SaaS company ordered approximately $60,000 in onboarding and event swag across three offices. Within 18 months, more than a third of it sat untouched due to rebrands, size mismatches, and duplicated SKUs. After centralizing inventory and shifting event swag to on-demand, they cut carrying costs by 32 percent in the first year and eliminated stockouts entirely.
ROI snapshot
This is why saving 15 percent on unit cost with big bulk orders often backfires. If items sit for more than nine to twelve months, the carrying cost usually destroys the discount.
This makes it clear that “cheap unit pricing” is not the real story if your inventory does not move.
The Swag Inventory Maturity Model
Before making any changes, you need to know your current status. The maturity model provides a quick way to assess your current program and identify the next best step.
| Level | Symptoms | Typical carrying cost | Next step |
| 1. Closet chaos | No tracking, duplicate SKUs, frequent stockouts | 35 to 40 percent of the value | Start a central spreadsheet and run quarterly counts |
| 2. Spreadsheet survival | Manual entry, reactive reorders, limited visibility | 30 to 35 percent | Add basic barcode software and receiving processes |
| 3. Basic software | Single location tracking, reorder alerts, basic reports | 25 to 30 percent | Extend to multiple locations and forecast based on demand |
| 4. Integrated platform | Real-time inventory, company stores, automated replenishment | 18 to 25 percent | Layer on analytics and predictive dead stock alerts |
| 5. Strategic intelligence | Forecast tied to campaigns and hiring, just-in-time kitting, and a complete KPI dashboard | 15 to 20 percent | Maintain, test, and refine the program each quarter |
ROI snapshot
When companies transition from Level 2 to Level 4, they typically reduce carrying costs by 30 to 40 percent, decrease stockouts by approximately 60 percent, and free up 10 to 15 hours of manual work every week.
BlinkSwag angle
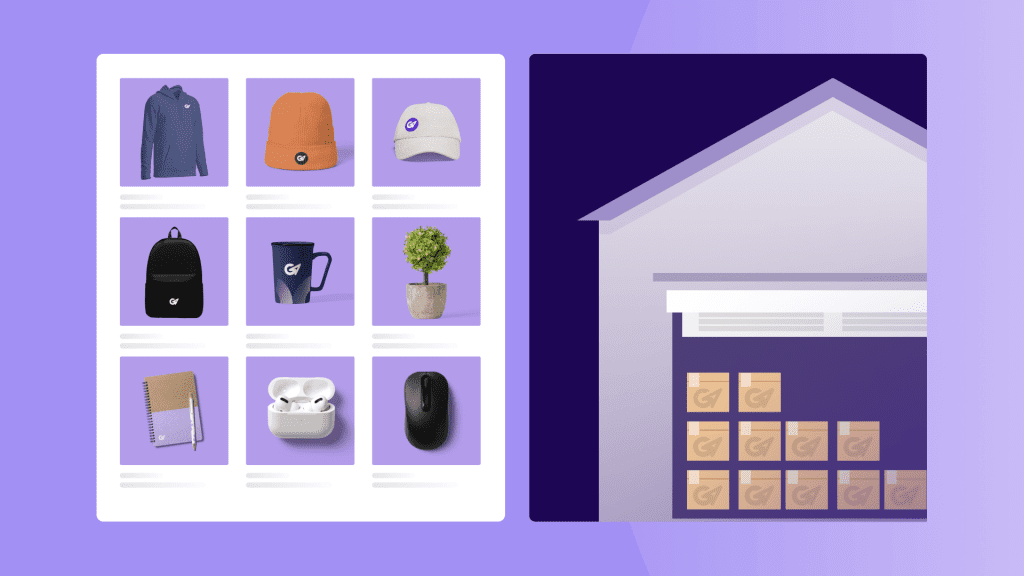
BlinkSwag sits at Level 4 and Level 5. Instead of trying to build an inventory platform yourself, you gain real-time visibility, company stores, and automation, which are already in place and working.
Swag Inventory Maturity Assessment
If you only do one thing after reading this:
Assess your swag inventory maturity level.
It takes five minutes and gives you a clear next step with cost benchmarks.
- Your Level 1 to Level 5 score with cost benchmarks
- A simple 90-day improvement roadmap
- An estimate of your annual savings opportunity
Use the worksheet with your team in your next planning meeting. When you are ready, bring your score into a BlinkSwag conversation and design your upgrade path.
Bulk, On-Demand, Or Hybrid: Choosing The Right Model
One of the highest-leverage decisions is how you actually buy swag. Bulk lowers unit cost but increases carrying cost. On-demand raises unit cost but removes storage. Most teams land in the middle with a hybrid mix.
| Model | Unit cost | Carrying cost | Best for |
| Bulk ordering | Often 8 to 12 dollars | High, around 25 to 30 percent | Core items with predictable, fast-moving demand |
| On demand | Often 12 to 18 dollars | Near zero | Seasonal, event-specific, or trend-driven items |
| Hybrid | Blended 10 to 15 dollars | Moderate, 10 to 15 percent on bulk | Most companies with mixed and evolving needs |
A simple rule of thumb helps:
- If an item is returned within six months, bulk usually wins on cost.
- If it sits for more than nine to twelve months, the demand is usually cheaper.
- Many companies save 20 to 35 percent by running a hybrid program, with bulk for core SKUs and on-demand for campaigns and events.
This is why the SaaS team above moved events to on-demand while keeping onboarding kits in bulk.
BlinkSwag angle
BlinkSwag makes hybrid realistic. You pre-stock core items in a BlinkSwag warehouse and run event or seasonal swag on demand from the same dashboard: no separate vendors, no juggling spreadsheets and freight quotes.
Bulk vs On-Demand Cost Calculator
Find your optimal inventory mix in two minutes:
- Enter annual swag spend and current turnover
- See the projected carrying costs for bulk, on-demand, and hybrid options.
- Get a recommended bulk and on-demand split.
- Estimate annual savings compared to your current approach.
Use the calculator inside your KPI template now and connect with BlinkSwag later when you want the same logic wired directly into your inventory platform.
KPIs That Keep Your Swag Program Honest
You do not need a complex dashboard to run swag like a pro. A short list of KPIs is enough to determine if you are overstocked, understocked, or stuck with dead stock.
| KPI | Meaning | Healthy range | Example status |
| Inventory turnover | How many times does the inventory sell through yearly | 4 to 6 turns | 5.0 turns (on track) |
| Days on hand | How long will the current stock last | 60 to 90 days | 72 days (healthy) |
| Dead stock percentage | Items with no movement for 6 months | Below 10 percent | 12 percent (needs attention) |
| Stockout rate | Orders you cannot fulfill | Below 2 percent | 1.4 percent (good) |
| Carrying cost percentage | Carrying cost divided by inventory value | Below 20 percent | 23 percent (room to improve) |
| Fulfillment accuracy | Orders are shipped correctly the first time | Above 98 percent | 97 percent (close) |
Free Swag Inventory KPI Dashboard Template
Use a simple sheet to track the six metrics that matter:
- Pre-built columns and basic formulas
- Targets for green, yellow, and red status
- Space for monthly notes and actions
Paste it into Google Sheets or Excel. Plug your data from BlinkSwag or from your current system. Over the next few months, you will be able to pinpoint exactly where money is leaking and where stock is too tight.
FAQ
How much should we budget for inventory software or a platform?
Basic barcode systems typically cost around $1,000 to $2,000 upfront and $50 to $200 per month. Integrated platforms that include inventory, company stores, and analytics usually fall within the $200 to $1,000 per month range. Most platforms pay for themselves within a few months through waste reduction alone, especially when compared to the 25-30 percent annual carrying cost of your swag.
What is a healthy inventory turnover rate for swag
Aim for four to six turns per year. “Below three” typically indicates that you are overstocked and at risk of dead stock. Above eight means you are cutting it too close and may be dealing with constant stockouts.
When should we outsource kitting instead of doing it in-house
If you create fewer than 100 simple kits per month, doing it in-house can be effective. Once you reach 100 kits a month or work with complex packs that include several items and custom packaging, a kitting and fulfillment partner like BlinkSwag typically saves 40 to 60 percent in labor costs and errors.
How do we calculate our carrying cost percentage?
Add up everything you spend on storage, insurance, labor, obsolescence, shrinkage, and the estimated opportunity cost of the money tied up in swag. Divide that total by your average inventory value. Many teams are surprised when this number sits between 25 and 30 percent.
What is the fastest way to reduce dead stock?
Start with quarterly reviews of SKUs that have not moved in ninety days. Tighten seasonal and event orders for four to six weeks before use. Use choice-based company stores, where employees can select items and sizes they actually want, rather than relying on you to guess their size curves and style preferences.
Choose Your Next Step With BlinkSwag
Swag should support hiring, retention, and brand reach without burning a third of your budget in storage, labor, and dead stock. With a clear view of cost, a simple maturity model, and a hybrid buying strategy, you can treat swag like a controlled asset instead of a guessing game.
Diagnose and measure
- Use the maturity worksheet to score your current state.
- Use the KPI template to track real numbers every month.
Implement and scale with BlinkSwag.
- Central inventory and branded company stores
- Hybrid bulk and on-demand fulfillment
- Kitting, shipping, and analytics in one place
Action options
- Diagnose your current state.
Download the self-assessment worksheet and score your swag maturity in five minutes. Please bring that score to your next planning session.
- Calculate your hidden costs.
Use the KPI and TCO template to see how much carrying cost is hiding behind your purchase orders and where a hybrid model would save you the most.
- See the platform in action.
When you need a single platform for inventory, company stores, on-demand production, and kitting, BlinkSwag can demonstrate a live environment in just fifteen minutes.
Start with worksheets and templates. Add the platform when you are ready. The goal is simple: less budget stuck in closets, more swag in the hands of people who actually use it.